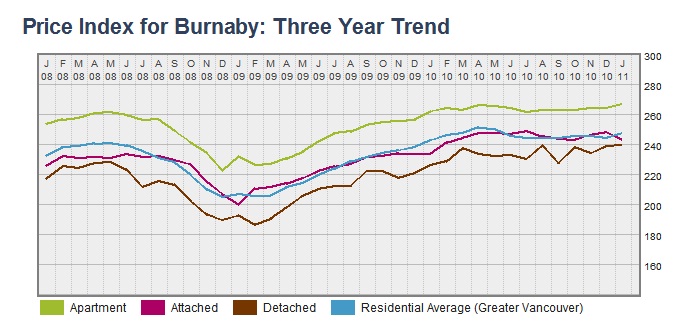
Burnaby HPI trend line
click on graph to enlarge

Greater Vancouver consists of a number of communities, each with a different background story, atmosphere, and unique housing market conditions. If you consider buying or selling in Vancouver, the knowledge of region-to-region real estate activity variations can really make a difference. Let’s have a closer look at the Burnaby real estate statistics, released by the Real Estate Board of Greater Vancouver (REBGV).
Burnaby is one of the biggest communities in Greater Vancouver, so there’s no doubt that its statistics have a significant effect on the Greater Vancouver average. The REBGV measures the prices of properties with a Housing Price Index (HPI), which shows how much the price of a typical home has risen since 2001, when the index was set to 100 points. The Greater Vancouver residential average in January 2011 was 247.1 points, which was 2.1 per cent higher in a year-over-year comparison and 37.4 per cent up from the year 2006.
Detached housing in Burnaby showed lower-than-average increase in prices with an HPI of 239.3 points, but recorded the fastest growth year-over-year with a 6 per cent rise. In a five year comparison, the index for Burnaby’s detached houses went up 38 per cent. Attached housing prices moderated from the month before, but went up to 242.4 HPI points in a year-over-year comparison, which was a 4 per cent rise. Apartment unit prices increased by 40.4 per cent from the 2006 level, which was the highest gain among all the other housing types, although in a year-over-year comparison, the pace of apartment housing price growth was the slowest, with 1.8 per cent resulting in a January 2011 HPI of 266 points.
The benchmark average residential property price was estimated by the REBGV at $585,068 for the whole Greater Vancouver Area in January 2011. Burnaby’s benchmark detached houses sold for $812,874, while an attached benchmark property cost only $483,922. Apartments were even cheaper, with a benchmark property price of $355,927.
When looking at the Three Year Trend graph, we can see that detached housing is the most volatile type of housing when it comes to prices. After a relatively stable Q1 of 2008, the HPI fell suddenly in Q2 — more steeply than any other housing type. After a brief period of growth in 2008’s Q3, the slump continued and bottomed out at around 190 points in February 2008, when the prices started rising quickly. They slowed their pace afterward and began oscillating violently in 2010, returning four times to a level of approximately 240 HPI points, where they ended in January 2011.
Both apartment and attached housing had a good start in 2008 with stable price conditions. Both started to plummet, though, in Q3 of 2008 as the market collapsed, but behaved very differently at the beginning of 2009. Apartment prices saw a spike of about 10 HPI points in January 2009, while attached housing continued its fall for another 10 HPI points below the average residential price index trend line for Greater Vancouver. After both markets recovered and started to follow the Greater Vancouver residential average trend line once again at the end of Q1, 2009, prices started a healthy rise until both price indexes levelled off at the beginning of 2010. Apartment and attached housing prices have remained relatively constant since then.
Greetings ! do you have the price index of single houses in Burnaby [or South Burnaby in particular] in the years 1981, 1982, 1983 & 1984 ?
Mucho gracias if you can help me.
Tks.
sun