 Vancouver East HPI click to enlarge
According to the Real Estate Board of Greater Vancouver (REBGV), Greater Vancouver housing demand continued to be strong throughout February 2011, with an above-average number of homes both sold and listed through the Multiple Listing Service, though the intensity of real estate activity varied between neighbourhoods. So if you’re planning to become a buyer or a seller in one of Vancouver’s beautiful communities, knowledge of the local housing market is very important for making a sound decision. To provide a clearer picture of the housing market conditions in the various areas of Greater Vancouver, we continue our neighbourhood statistics series with Vancouver East real estate numbers.
Compared to Vancouver West, Vancouver East’s detached properties aren’t skyrocketing in price and the overall prices are much lower in most cases. The benchmark price for a typical detached house in Vancouver East was $777,210 while a typical property in Vancouver West sold for a shocking $1,850,072. Benchmark prices for attached housing and apartments in Vancouver East were $538,702 and $340,277, respectively. The Housing Price Index (HPI), which measures the percentage increase in prices of a typical property over time (it was set to 100 points in 2001), rose to 263.2 points for detached properties in February 2011. This was up 6.5 per cent year-over-year and 13.3 per cent from February 2008.
Detached homes’ HPI grew by 7.3 points from the month before. Attached properties recorded a fall of 4.6 points from the previous month reaching 251.9 points, which is a 3.3 per cent increase compared to the previous year and a 6.7 rise from February 2008. Apartments were the slowest to grow in prices year-over-year (3.1 per cent) and compared to February 2008 (3.3 per cent), but they had the fastest growth in prices from the month before, going up by 9.3 HPI points to reach 278.6 points.
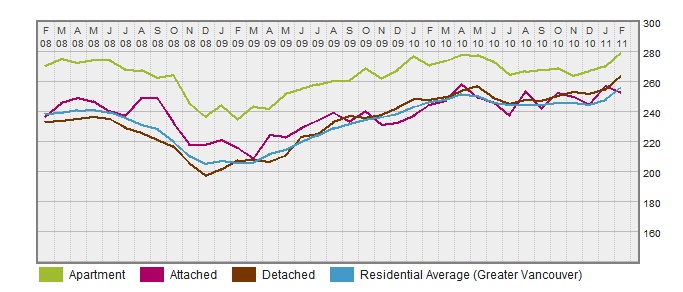
Looking at the long-term residential housing prices trend lines, a correlation between the Greater Vancouver residential average and the three housing types trend lines is visible. Detached housing is following the Greater Vancouver residential average closely, staying slightly below the average and plummeting with it in 2008, while bottoming out at almost 10 HPI points lower than the average. Detached properties in Vancouver East started to recover and rise in December 2008 and, while oscillating slightly, moved above the average trend line, where they stayed since June 2009. The index rose throughout 2009 and levelled off in May 2010, reaching almost 260 HPI points. The index moderated since then by 10 points and started a steady rise to reach the new record of 263.2.
Attached housing started the year 2008 with a surprising rise in prices and, as the whole market started collapsing, a second rise occurred in July 2008 which lasted until September 2008, when the prices finally plummeted to a level of about 220 HPI points. Attached housing stayed stable from November 2008 to January 2009, when the prices experienced a dip which bottomed out in March 2009. A period of growth continued until April 2009, when the prices started oscillating, but stabilized in November 2009, and started rising steadily up to a record level of almost 260 points. Since then, the price index exhibited a seesaw pattern until descending to the February level of 251.9 points while the rest of the market grew.
Apartments were less volatile than attached houses, falling steadily throughout 2008 and stopping at about 235 HPI points, spiking and falling again in the beginning of 2009 and starting a period of growth with two or three minor oscillations until levelling off at almost 280 HPI points in April 2010. The prices moderated considerably throughout June and July 2010 but started rising slowly since then, picking up speed in 2011 and reaching a new maximum of 278.6 points in February 2011.