 Pitt Meadows Marshes by Pete

Metro Vancouver incorporates a number of municipalities and districts that all have different real estate markets. This diversity can confuse not only the first-time home buyer, but also people who have experience in real estate transactions through the Greater Vancouver MLS. Rosario Setticasi, REBGV president, says, “It’s important for people entering the market to understand that activity can differ significantly depending on the area and property type.” The total sales for the Greater Vancouver Area reached a mediocre 2,378 in August 2011 — the third lowest in the last ten years, but new listings reached a 16-year record, which resulted in a balanced market last month. Now let’s take a closer look at one of the municipalities in the Metro Vancouver Area: let’s analyze the Pitt Meadows real estate market.
Pitt Meadows
Pitt Meadows, a town stretched between Maple Ridge and the bank of the Pitt River on the west, has a population of about 17,410, a beautiful environment in the vicinity of the largest freshwater tidal lake in the world, the Pitt Lake, and a large wildlife refuge. Buildings in the mostly residential Pitt Meadows community aren’t allowed to be high; this is because of the proximity of the Pitt Meadows Airport. Most of the land in the Pitt Meadows district is agricultural, and most of the inhabitants commute to work to other parts of Metro Vancouver daily.
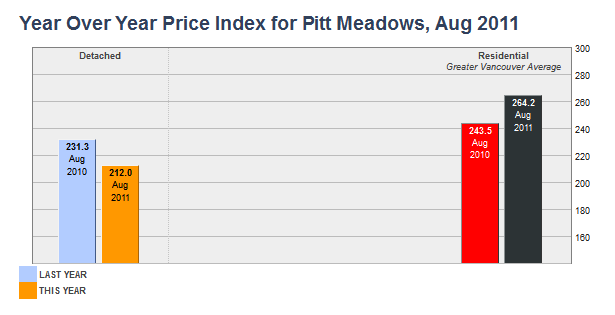
Year Over Year Prce Index for
Pitt Meadows for August 2011

Pitt Meadows Real Estate
The average price of a benchmark residential property in the Greater Vancouver Area was $625,578 in August 2011, while Pitt Meadows recorded an average price of $516,510 for detached houses. The three-month average for detached properties was $544,482 in August 2011, which points to a slight decline in prices over the previous year. The year-over-year comparison reveals that the prices moderated by 8.3 per cent. Compared to August 2008, they rose by 12 per cent, and by 16.7 per cent compared to August 2006. There weren’t enough sales of apartment units and attached houses for the Real Estate Board of Greater Vancouver to be able to measure statistics for these housing types.
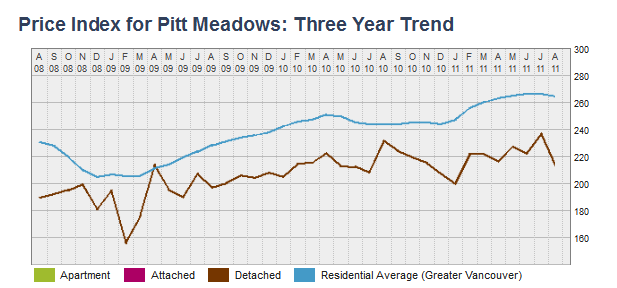
Price Index for Pitt Meadows
Three Year Trend

Pitt Meadows Housing Price Index
The housing price index is measured in HPI points, which represent the percentage rise of the price of a typical constant quality property over time. The index was averaged to 100 in 2001. When we look at the three-year trend for the Pitt Meadows housing price index, we can see that it has a pretty unpredictable character. The index rose from the August 2008 level of 190 points to the November 2008 level of 200 points, then experienced a double dip, falling slightly below 160 HPI, but recovered quickly to about 213 points in April 2009. The trend line levelled off for a bit, although it exhibited a slightly rising seesaw pattern. In August 2010, the line reached over 230 points and then started a steady fall to reach 200 HPI points in January 2011. The year 2011 began wilt a quick jump to over 220 points in February and reached almost 240 points in July, when it slumped suddenly to the current August 2011 level of 212 HPI points.
Are house prices in Pitt Meadows increasing or decreasing? Also, by how much of a price value will a house next to a freight track & a local airport decrease by? Let’s say if a house is bought for $500,000 now & it’s next to those 2 downsides, how much will the price value be few years down the road if it were to be sold in the house market?