
North Vancouver HPI
click on graph to enlarge
The real estate market conditions vary greatly from region to region in the Greater Vancouver Area, so if you’re planning to be a buyer or a seller in one of the lovely Vancouver neighbourhoods, take your time to fully familiarize yourself with the ups and downs of your target market. The Real Estate Board of Greater Vancouver releases monthly housing statistics for all the areas of Greater Vancouver, so let’s have a closer look at the North Vancouver real estate numbers.
The benchmark price of a typical residential property was $585,068 on average in the Greater Vancouver Area in January 2011. The Housing Price Index (HPI), which measures the increase in prices of a residential benchmark property over time (set to 100 in 2001) was 247.1 in the Greater Vancouver Area in January 2011.
Detached housing in North Vancouver had a benchmark price of $875,910 in January 2011, and, with an HPI of 219.1 points, went up from the month before, but declined on a year-over-year comparison by 3.3 per cent. A typical attached house sold for $592,640 in January 2011. The HPI for this type of housing moderated from the month before, but increased slightly by 1.1 per cent in a year-over-year comparison. The index for attached housing in January was very close to the 2008 number, with only a 0.2 per cent rise. The benchmark price for an apartment in North Vancouver was $379,620 in January 2011. The HPI for apartments in North Vancouver increased to 241.5 points in January compared to December 2010, but dropped by 0.9 per cent in a year-over-year comparison. In 2008, the HPI for apartments in North Vancouver was 0.2 per cent higher than the January 2011 HPI.
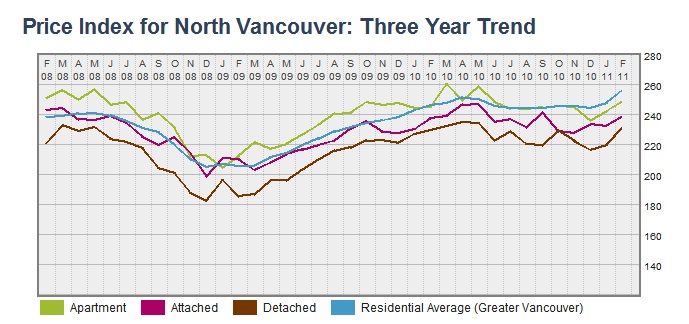
Looking at the long-term trend line, we can clearly observe a great deal of volatility in prices of all housing types from 2008 to 2011. Detached housing stayed below the average Greater Vancouver trend line during the whole period, starting at slightly above 230 HPI points, then sliding down with minor oscillations until it bottomed out at almost 180 HPI points in December 2008. At this point, the detached housing trend line recorded a major spike and, after recovering, started a slow and smooth rise towards its peak of almost 240 HPI points in April 2010. After that, it moderated to about 220 HPI points in January 2011 while oscillating violently.
The North Vancouver attached housing HPI trend line held to the residential average for Greater Vancouver from the beginning of 2008 to October 2009, but was oscillating significantly. The line fell by almost 10 HPI points from the average after this period and continued with a stable growth until May 2010, when it started falling with the rest of the market. It spiked sharply in September 2010, but recovered to levels slightly below 230 HPI points, then rose to reach the January 2011 level of 231.9 points.
The HPI trend line for apartment housing in North Vancouver was following the residential average trend line in a volatile manner. Apartment housing was above the residential average almost constantly from 2008 to 2011. It fell below the average for a short time in the middle of the crisis in January 2009 and also between two big price spikes in March and May 2010. After these spikes, the trend line followed the residential average closely but fell from it in November 2010. Since then, it has recovered slightly.